Visualizing Data: How to Add Power BI Reports to Business Central
Introduction
Power BI is a great tool for turning data into clear, interactive reports and the best part?
It works smoothly with Business Central, right out of the box.
You just need to set it up, and you can start viewing powerful reports right inside within Business Central dashboard.
Microsoft provides several ready-made reports, grouped into different apps, so you can pick and install only what you need.
Once set up, these reports help you track key business insights without switching between systems.
In this blog, we’ll walk you through how to set up and use Power BI reports in Business Central to make smarter decisions.
References
Configuration
Open your Business Central and search for "Assisted Setup".

Click on "Connect to Power BI"

Once the set up page opens, click on Next.
Fiscal: A 12-month calendar that begins in any month and ends 12 months after.
Standard: A 12-month calendar that begins on January 1 and ends on December 31.
Weekly: A calendar that supports 445, 454, or 544 week groupings.
The first and last day of the year might not correspond to a first and last day of a month, respectively.
The first and last day of the year might not correspond to a first and last day of a month, respectively.

Specify the timezone.

Specify the working days.

Here, it asks for configuring individual apps for Power BI.You can skip this for now as we'll be back at this later.

In the next screen, specify the environment name and the company name.

Now, we'll install the "D365 Business Central - Sales" app in Power BI.
Go to your Power BI dashboard and click on Apps.

Search for Business Central
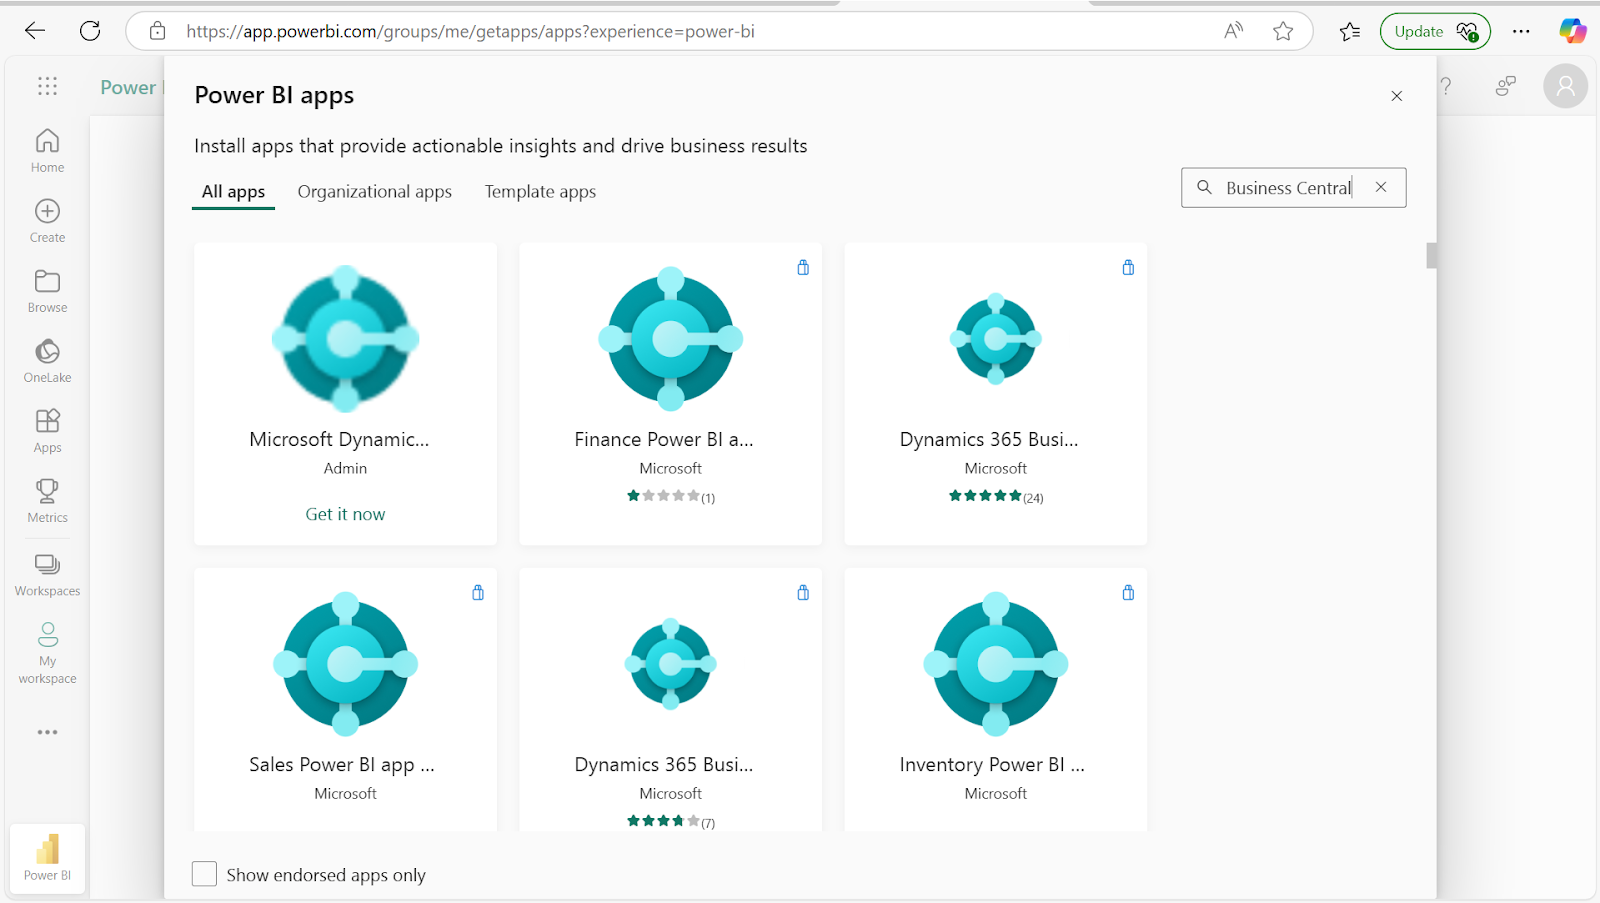
Open the relevant one and click on "Get it now"


Then click on "Install"

Wait for a few seconds till the installation is complete.

Now, when you open the report for the first time, it'll show the report with sample data.
To view it with your own data, we need to connect the data to Business Central.

Enter the company and environment name.
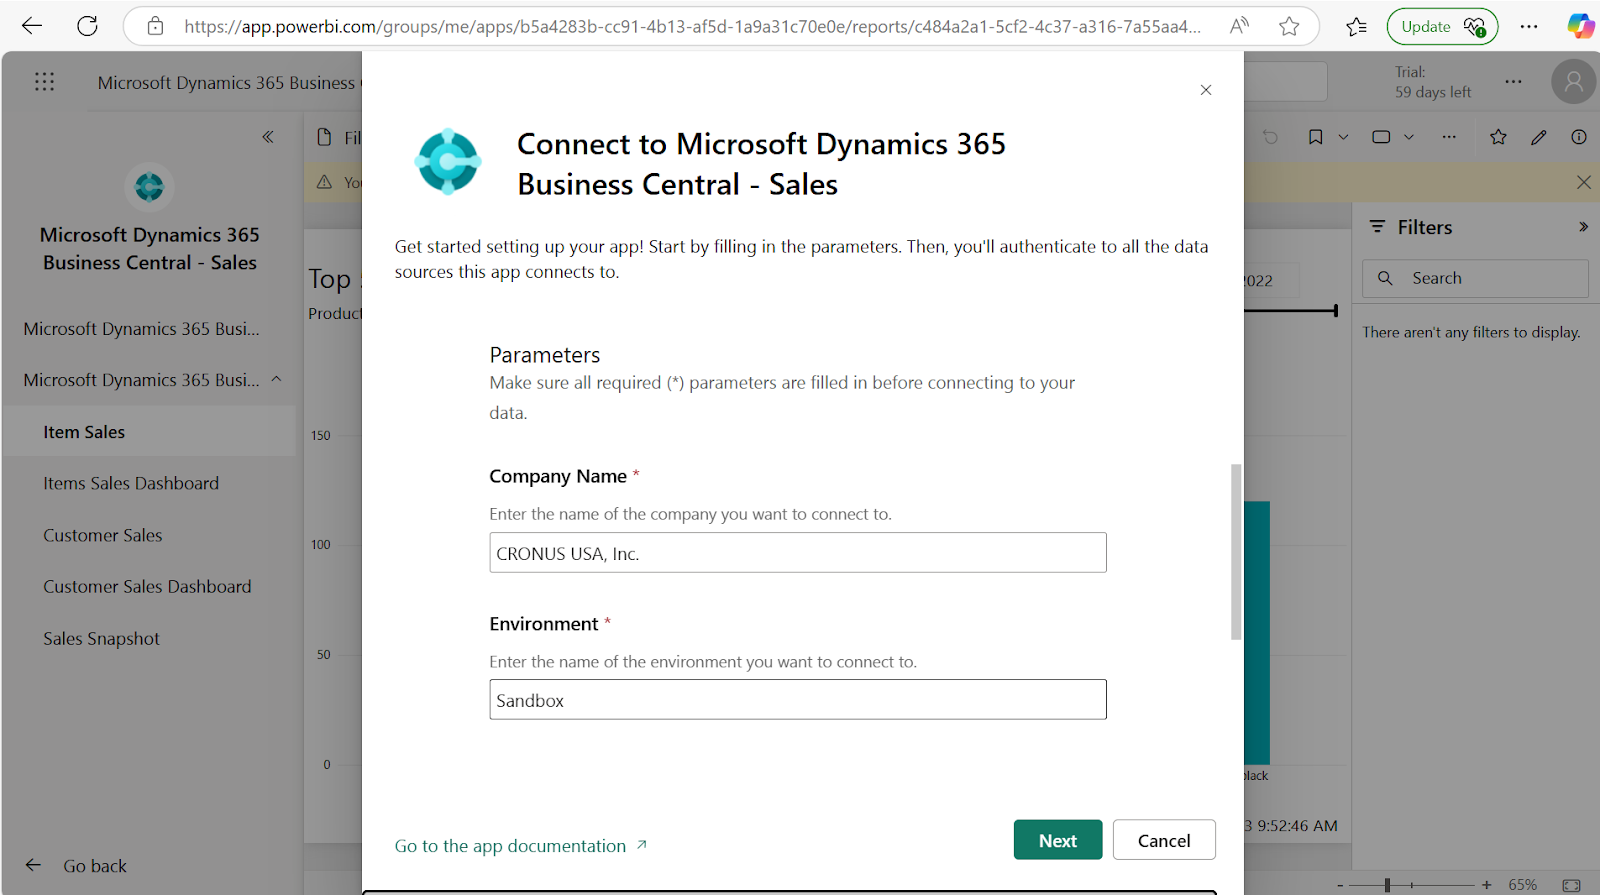
Specify the authentication method to OAuth 2.0 and click on "Sign in and connect"

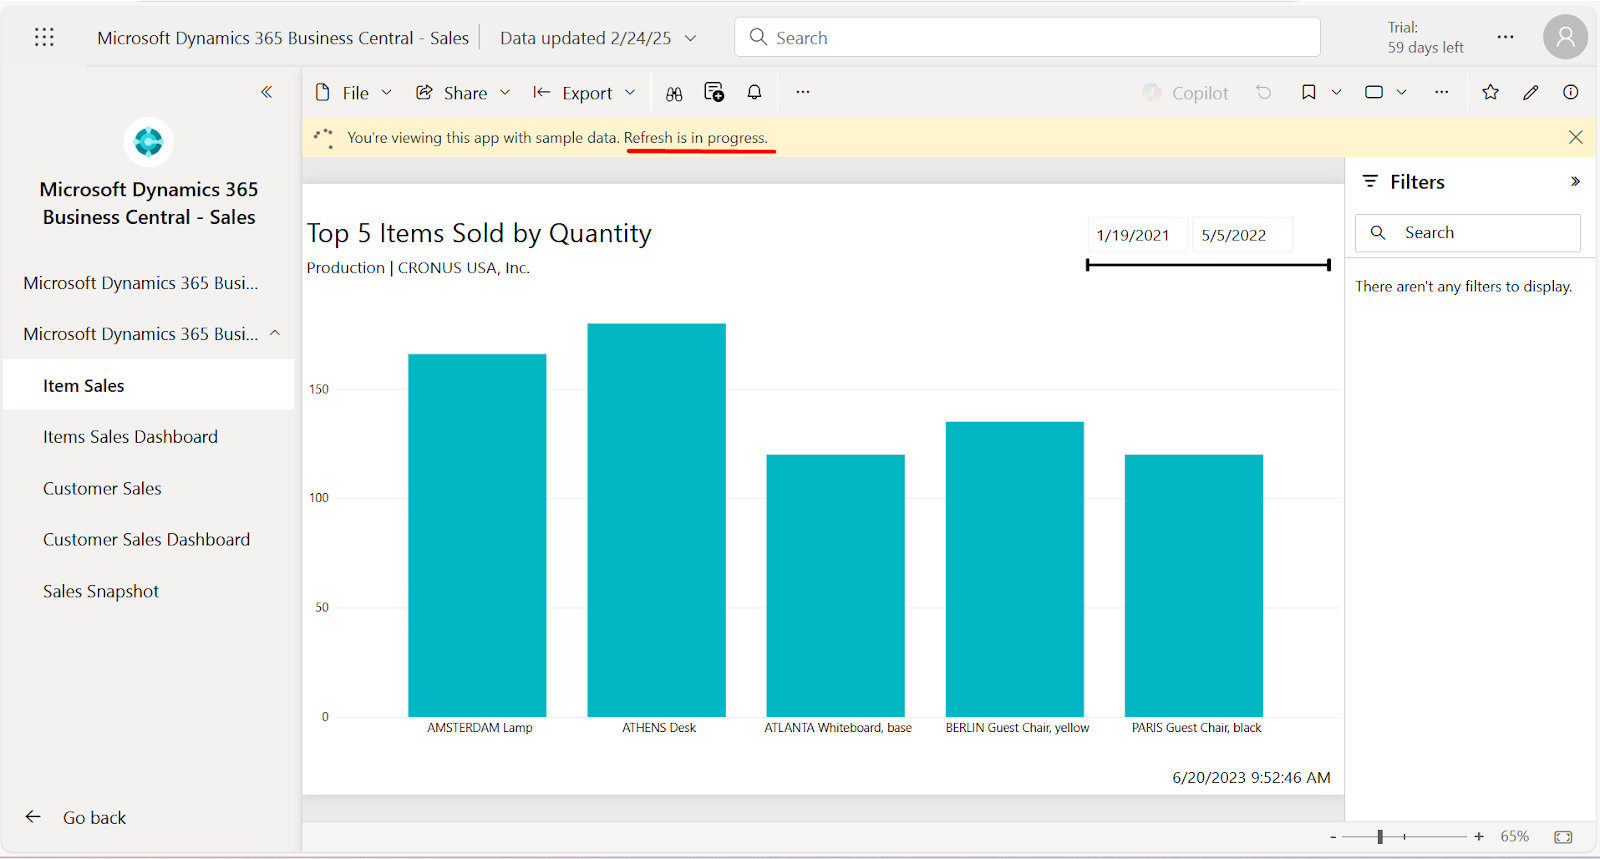
After a few minutes, the refresh will be completed and you'll see your data.

Once this is done, search for "Power BI Connector Setup"

In the relevant tab, Sales Report for this example, click on "Power BI Sales" field's drill down.
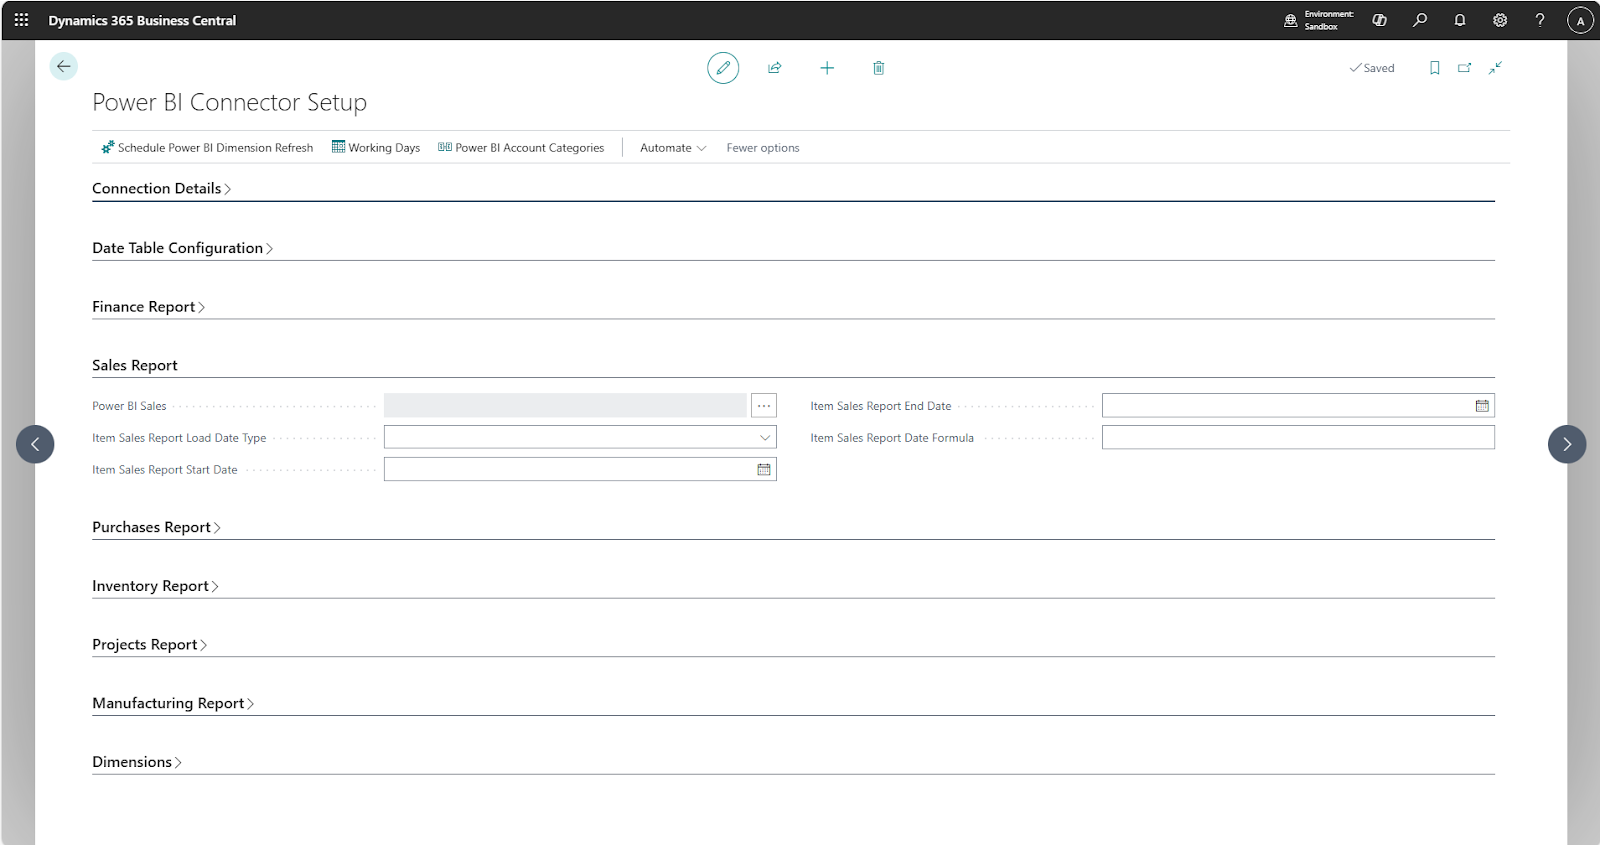
Select the app that you installed.

Now go back to your Business Central dashboard and scroll down to the "Power BI" section.

Click on the "Get Started with Power BI" and keep clicking on Next till the end of the setup.


If there are any selected reports, you will see the relevant report.If not, you'll see the following-

In either case, click on the drop-down next to Power BI or click on the "Select reports"

Scroll down to find the appropriate report and click on "Enable" and then click on Ok.

You will see your Power BI report on the dashboard.

You can enable multiple reports and cycle through them by clicking on the "Next" and "Previous" buttons.

You can also expand the report to see it as a full page within Business Central by clicking on the "Expand" page.

You can further view it in Fullscreen as well.

If you want to see multiple reports on the same page, we can create a custom role center and add multiple reports to them.
For example, I've created a "Power BI dashboard" role center.
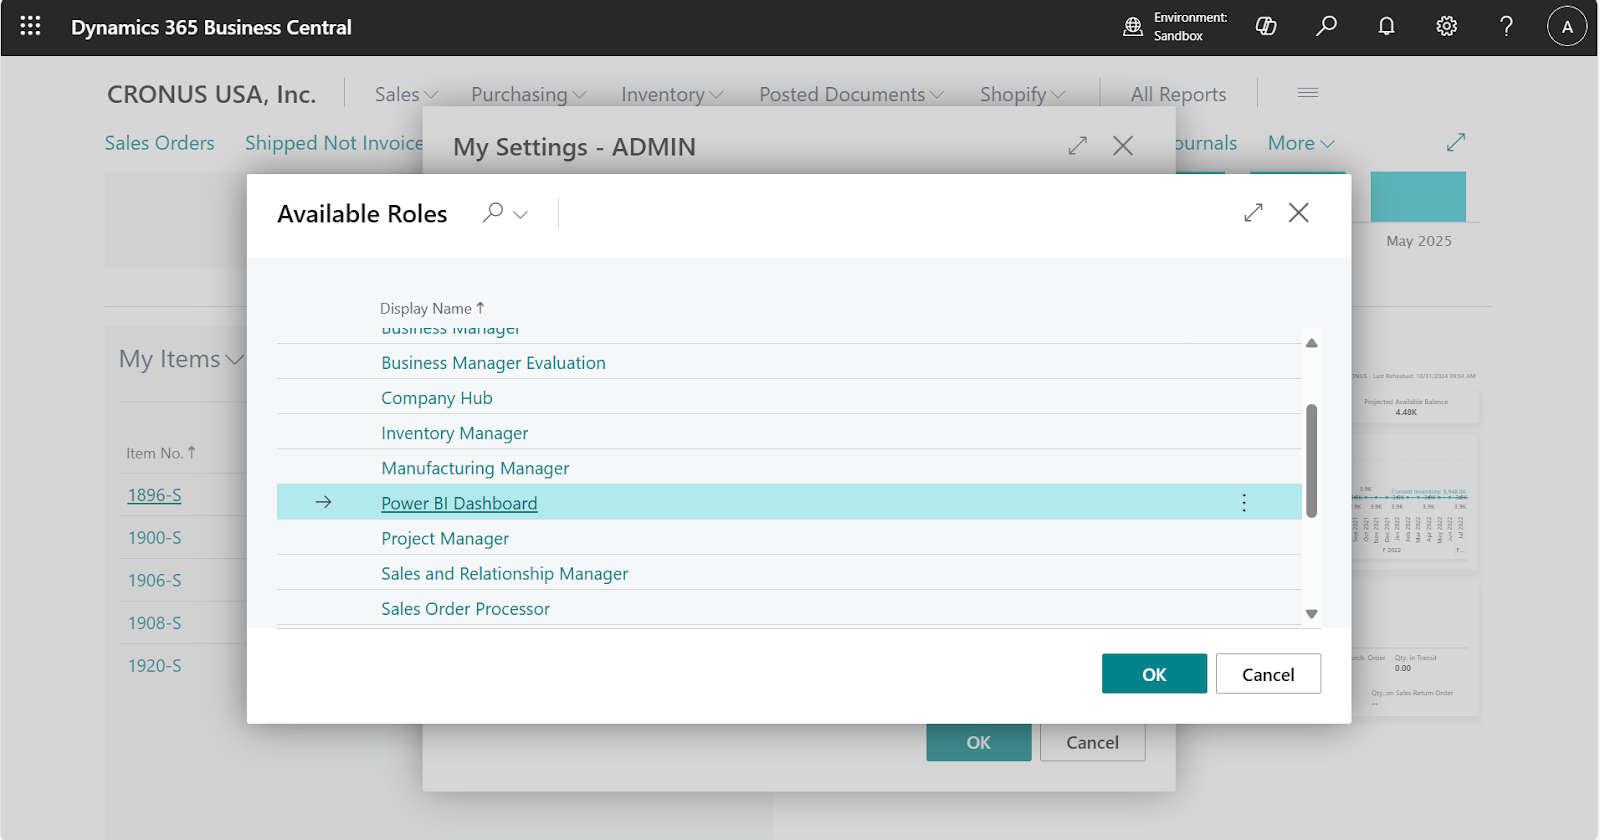

In this way, we can have n number of reports on our dashboard.
Source Code - BCApps-PowerBIDashboard
Here, it asks for configuring individual apps for Power BI.
In the next screen, specify the environment name and the company name.
Now, we'll install the "D365 Business Central - Sales" app in Power BI.
Go to your Power BI dashboard and click on Apps.
Search for Business Central
Open the relevant one and click on "Get it now"
Then click on "Install"
Wait for a few seconds till the installation is complete.
Now, when you open the report for the first time, it'll show the report with sample data.
To view it with your own data, we need to connect the data to Business Central.
Enter the company and environment name.
Specify the authentication method to OAuth 2.0 and click on "Sign in and connect"
After a few minutes, the refresh will be completed and you'll see your data.
In the relevant tab, Sales Report for this example, click on "Power BI Sales" field's drill down.
Now go back to your Business Central dashboard and scroll down to the "Power BI" section.
Click on the "Get Started with Power BI" and keep clicking on Next till the end of the setup.
If there are any selected reports, you will see the relevant report.
If not, you'll see the following-
In either case, click on the drop-down next to Power BI or click on the "Select reports"
Scroll down to find the appropriate report and click on "Enable" and then click on Ok.
You will see your Power BI report on the dashboard.
You can enable multiple reports and cycle through them by clicking on the "Next" and "Previous" buttons.
You can also expand the report to see it as a full page within Business Central by clicking on the "Expand" page.
You can further view it in Fullscreen as well.
If you want to see multiple reports on the same page, we can create a custom role center and add multiple reports to them.
For example, I've created a "Power BI dashboard" role center.
In this way, we can have n number of reports on our dashboard.
Source Code - BCApps-PowerBIDashboard
Conclusion
Setting up Power BI in Business Central is a simple way to bring your data to life.
With just a few steps, you can connect your reports, see real-time insights, and make better business decisions all without leaving Business Central.
Whether you need sales trends, financial reports, or custom dashboards, Power BI makes it easy to track what matters most.


Comments
Post a Comment